
Introduction Each quarter, Zillow drops a data-rich press release that sets real-estate Twitter buzzing and agents scrambling to update client advice. The latest 2025 Market Report arrived with 40 pages of heat-maps, median-price curves, and economic footnotes—powerful insight, yet overwhelming if you just want the bottom line. This guide distills the release into clear numbers,
Introduction
Each quarter, Zillow drops a data-rich press release that sets real-estate Twitter buzzing and agents scrambling to update client advice. The latest 2025 Market Report arrived with 40 pages of heat-maps, median-price curves, and economic footnotes—powerful insight, yet overwhelming if you just want the bottom line. This guide distills the release into clear numbers, plain-English impacts, and quick actions for buyers, sellers, and investors. By the end you will know which metros are cooling, why starter-home inventory is shifting, and how rent trends may steer your next move.
What Is Zillow’s Market Report?
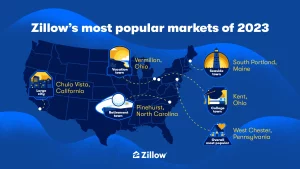
Image by: Yandex.com
Zillow aggregates millions of listing and mortgage records, then publishes a quarterly snapshot of U.S. housing health. Metrics include:
- Zillow Home Value Index (ZHVI) – median price for all homes, not just those sold
- Days to Pending – speed of accepted offers
- New Listings Count – seller supply entering the pipeline
- Rent Index – typical rent across multifamily and single-family units
Because Zillow sources both MLS feeds and user-posted “Make Me Move” properties, its sample size exceeds most government datasets and updates weeks faster.
Headline Numbers (Q1 2025 vs. Q4 2024)
| Metric | U.S. Average Q1 2025 | Q/Q Change | Y/Y Change |
|---|---|---|---|
| Median Home Value | $369,400 | +1.2 % | +4.7 % |
| New Listings | 1.18 M | +7.5 % | +3.1 % |
| Days to Pending | 19 days | +2 days slower | +5 days slower |
| Median Rent | $2,065 | +0.4 % | +2.2 % |
| 30-yr Rate Snapshot | 5.9 % | –0.2 pt | –0.8 pt |
Why it matters: Prices are still rising, but pace cooled. Slightly longer market time suggests negotiating power inching back to buyers.
Regional Winners & Laggards
Fastest-Growing Home Values
- Tampa, FL +8.9 % YoY
- Columbus, OH +8.1 %
- Charlotte, NC +7.7 %
Drivers: inbound tech jobs, mild climate, remote-work arrivals.
Price Decliners
- San Francisco Bay Area –3.4 % YoY
- Austin Metro –2.1 %
- Boise, ID –1.3 %
Reasons: high inventory of luxury flips, outmigration to cheaper suburbs, return-to-office mandates.
Inventory Snapshot
| Segment | Active Listings YoY | Notable Trend |
|---|---|---|
| Starter (<$300k) | +9 % | Builders shift to small-lot townhomes |
| Mid-tier ($300k–$700k) | +5 % | More move-up sellers unlocked by equity |
| Luxury (>$1 M) | +11 % | Spec homes linger as affluent buyers wait |
Takeaway: Entry-level buyers finally see more choices, though many listings need cosmetic updates to hit FHA appraisal lines.
Mortgage & Affordability Insights

Image by: Yandex.com
- Average principal-and-interest payment rose just 0.3 % thanks to lower rates offsetting price gains.
- 38 % of listings now advertise 2-1 buy-down incentives.
- FHA share of purchase loans climbed to 22 %, highest since 2011.
Tip for buyers: Ask lenders about assumable FHA loans—taking over a seller’s 2021 rate can shave $400/month on a $400k mortgage.
Rent Trends
- Sun Belt rents plateaued after two blistering years; Phoenix posted –0.8 % quarterly.
- Midwest college towns (Madison, Ann Arbor) saw +4 % due to limited new supply.
- Build-to-rent subdivisions make up 6 % of new housing starts, adding options but keeping overall rent inflation muted.
If you plan to invest, small metro midsize apartments (50–100 units) in university hubs show the strongest cap-rate spread over financing.
Investment Signals
| Signal | Why It Matters | Action Step |
|---|---|---|
| Rising starter inventory | More flips under $300k possible | Budget 15 % for rehab; focus on energy upgrades |
| Slower luxury demand | Negotiation leverage on high-end | Offer 10 % below ask with quick close |
| Stable rents + lower rates | Attractive yield spread | Lock 5-yr ARM for rental acquisition |
| Midwest resilience | Value play with less hype | Analyze Columbus, Cincinnati duplex cash flow |
Practical Tips for Each Audience

Image by: Yandex.com
Buyers
- Get pre-approved before touring; homes under $350k still move in 11 days.
- Use Zillow’s price-cut filter—14 % of Q1 listings dropped at least once.
- Negotiate seller credits for 2-1 buy-downs rather than price drops; monthly relief beats small price cuts at today’s rates.
Sellers
- Stage energy-efficient upgrades—homes with new heat pumps fetched 2.3 % premium.
- Price to appraise; 18 % of contracts fell through over valuation gaps.
- List mid-week; Thursday postings got the most weekend tours.
Renters
- Set Zillow alerts for move-in specials; 1 in 5 large complexes offers one free month.
- Compare build-to-rent communities—yard plus maintenance included often beats apartment pricing.
Investors
- Watch property tax revisions in high-growth counties; margin risk.
- Bundle insurance via portfolio carriers—climate premiums up 12 %.
- Target rehabs inside Qualified Opportunity Zones for deferred capital gains.
Conclusion
Zillow’s 2025 Market Report paints a balanced picture: national prices inch upward but pace slows, starter inventory expands, and mortgage relief helps keep payments flat. Regional differences sharpen—Sun Belt appreciation cools, Midwest strength grows. Whether you plan to buy, sell, rent, or invest, lean on local data slices inside the report, combine them with smart negotiating tactics, and stay flexible as rates and policies shift through the year.
Call to Action
Download Zillow’s full report, filter to your ZIP, and run the numbers against your budget. Share this breakdown with friends or clients, and subscribe for quarterly updates to stay ahead of market turns.